C_dashboard®

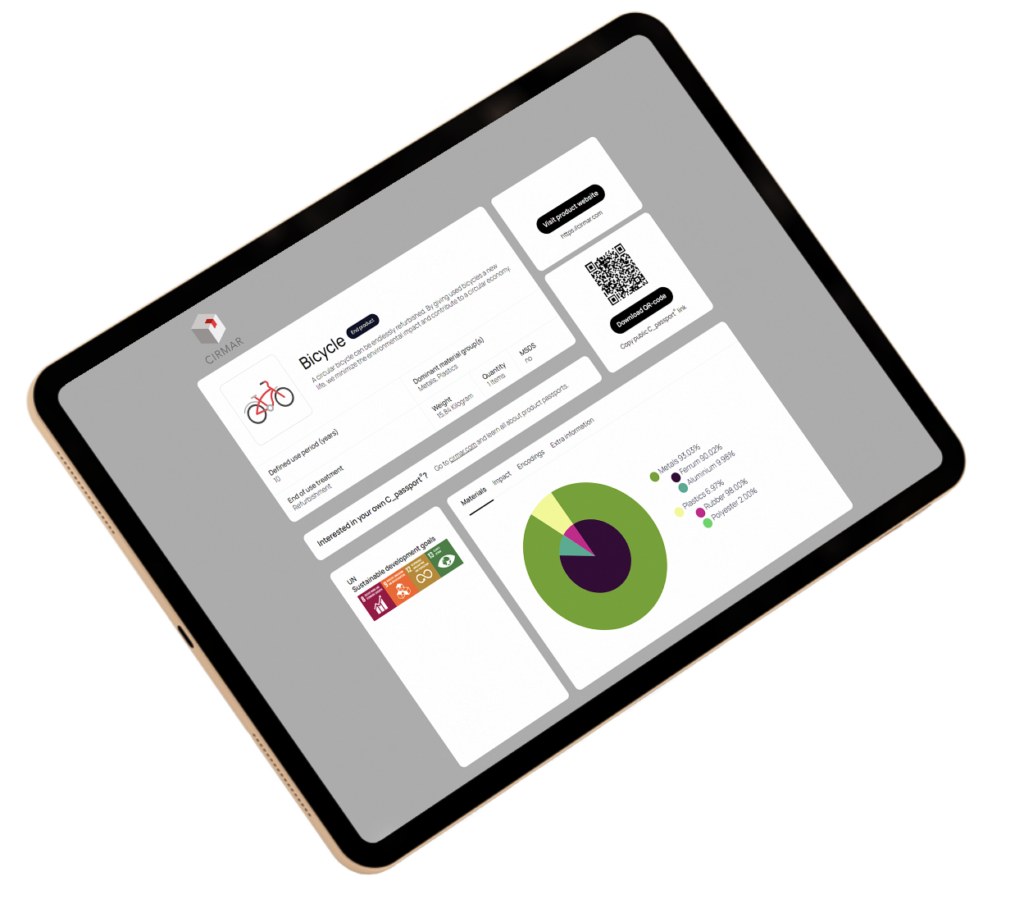
Your progress and outcomes, for one or more products, in one overview. Quantify materials, impact and carbon pricing. Present and communicate the results of your circular transition process. Impress your customers with impact data at a glance.

  • Combine passports
  • Show combined impact of passports
  • Convince customers by showing your contribution to their goals
  • Display KPI's and targets

    Choose which data you share internally and externally via C_dashboard®.
  • Monitor, report, and share interactively

    Quantify materials, impact and carbon pricing, as wel as the positive impact of your circular products and concepts.
  • Contribute to the SDG's

    Use C_dashboard® for CSRD or ESG reporting, or to show your contribution to the Sustainable Development Goals.

The impact of transparency.
For yourself and for your customers.

Circular transitions require smart choices. Not only for yourself, but also for your customers. With C_dashboard® you compare products, demonstrate the impact of product groups and make your results tangible. Your customers know what their options are, you see the positive impact of your actions. Make the right choice an easy one. C_dashboard® is ideal for showing your customers, with a tablet in your hand, that circular products are the future. Sometimes in order to understand, you first have to see it.
What does C_dashboard® cost?
dashboard